Rising waters | Rooted solutions
Mapping water quality in Ousewem: using modelling to improve our rivers
We are using advanced modelling to understand where pollution is coming from, how it moves through the landscape, and where NbS will have the greatest impact.
From the outset, Ousewem has aimed to assess the wider benefits of nature-based solutions (NbS) - not just for flood risk management but for improving water quality. Flood risk and water quality go hand in hand. When heavy rain falls, it doesn’t just cause flooding, it also washes pollutants such as nutrients, sediments, and chemicals from farmland, roads, and urban areas via the drainage network and the storm sewer overflows into our rivers. In addition, when we target nature-based solutions to slow the flow for flood risk reduction, we are at the same time allowing pollutants more time to assimilate in the environment - through settlement, adsorption and decay processes.
Poor water quality affects farming, biodiversity, and even drinking water sources. The same NbS that slow down floodwaters, like wetlands and soil management, can also trap pollutants before they reach our rivers - a major source of water quality issues in the Ouse catchment.
That’s where our modelling comes in. To make sure solutions are as effective as possible; we are using advanced modelling to understand where pollution is coming from, how it moves through the landscape, and where NbS will have the greatest impact.
How modelling helps target pollution hotspots
Building on our existing hydrological modelling, we have developed a nested modelling approach to assess pollution risks at multiple scales:
- Fieldmouse model - A high-resolution (10m) time-average pollution transport model that estimates nutrient and sediment concentrations, tracks pollutant travel times to York, and identifies high-risk areas based on connectivity. This model also generates risk maps that highlight where interventions can be most effective (see figure 1a)
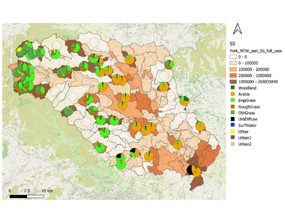
- HYPE model - An established modelling tool, previously co-developed with the Environment Agency for the Catchment-Sensitive Farming (CSF) programme. HYPE breaks down the contributors of different pollution sources - including agriculture, storm overflows, sewage treatment works, and urban runoff - over time (see figure 1b)
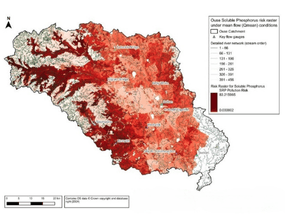
The image on the left (figure 1a) shows relative risk from phosphorus from Fieldmouse.
The image on the right (figure 1b) shows long term source apportionment from HYPE.
In all versions of the model used here we have used catchment-averaged loads distributed using broad land-use classes so these are not farm-specific.
By combining these 2 models, we can map pollution risks at different scales, from the whole-Ouse catchment scale (3,300km2) down to individual communities, helping refine local interventions (see figure 2).
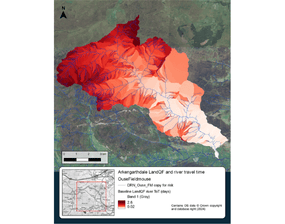
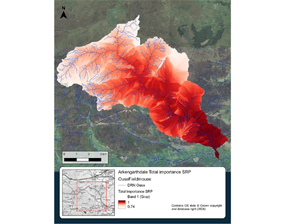
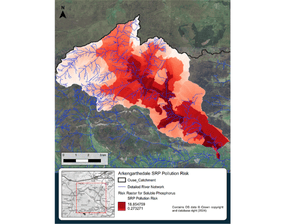
These 3 images (figure 2) show community scale travel time, importance grid and risk raster for phosphorus using Fieldmouse.
A closer look at pollution sources over time
Understanding where pollution originates is crucial - but knowing when and how it reaches our rivers is just as important. To gain this insight, we have used the Environment Agency’s HYPE model to sequentially switch different sources of pollution on and off, helping us build a clearer picture of their impact over time.
This allows us to break down pollution into key contributors including:
- agriculture - runoff from farmland carrying nutrients such as phosphorus and nitrates
- storm overflows (CSOs) - discharges from combined sewer systems during heavy rainfall
- sewage treatment works - treated wastewater that may still contain residual nutrients
- septic tanks - discharges from private wastewater systems in rural areas
- urban diffuse pollution - contaminants from roads, industrial areas, and urban surfaces
Visualising pollution through time
- by using pollutographs, we can see how pollution loads change over different timescales, including during heavy rainfall and dry periods. This helps us determine:
- the relative contributions of different pollution sources at any given time
- how pollution spikes correspond with rainfall and flood events
- where NbS could have the most impact in reducing pollution peaks
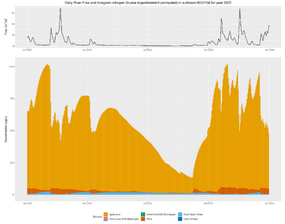
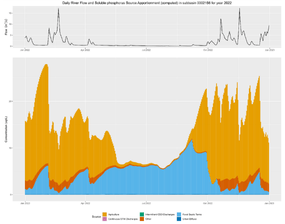
The images above show through-time source apportionment of soluble phosphorus and inorganic Nitrate for community using HYPE highlighting event-driven pollution runoff.
What’s next?
We're now using these models to:
- identify high-priority areas for pollution mitigation, aligning with hydraulic models to ensure NbS deliver multiple benefits
- support partners with priority risk maps, helping target landowner engagement
- transition to open data versions of these models, ensuring they remain available as a legacy tool for the Ouse catchment
- assess pollution mitigation in terms of “peak load avoided”, using methods like those applied in NFM research to quantify effectiveness
Barry Hankin, Chief of Environmental Modelling, JBA:
Understanding how pollution moves through the landscape is critical to making nature-based solutions as effective as possible. By combining large-scale risk mapping with detailed local modelling, we can identify where NbS will deliver the greatest benefits for both flood resilience and water quality.
How you can get involved
- Landowners and farmers - Our models can help identify the best places for NbS on your land, supporting both productivity and water quality. Get in touch to explore funding and opportunities
- Communities - Cleaner rivers benefit everyone. If you’re involved in local conservation or catchment projects, we’d love to collaborate
- Partners and policymakers - These insights are shaping the future of flood and pollution management. Collaboration and the exchange of innovative ideas are essential in the quest for flood resilience, so get in touch
Rachel Flood, Project Manager for Ousewem:
This work isn’t just about data - it’s about using the best available science to support landowners, communities, and policymakers in making informed decisions. With these models, we’re creating a legacy of knowledge that will help improve water quality for years to come.
Join the conversation and help create a healthier, more resilient Ouse catchment.